TradingView مؤشرات
مؤشر مستويات الفراكتل
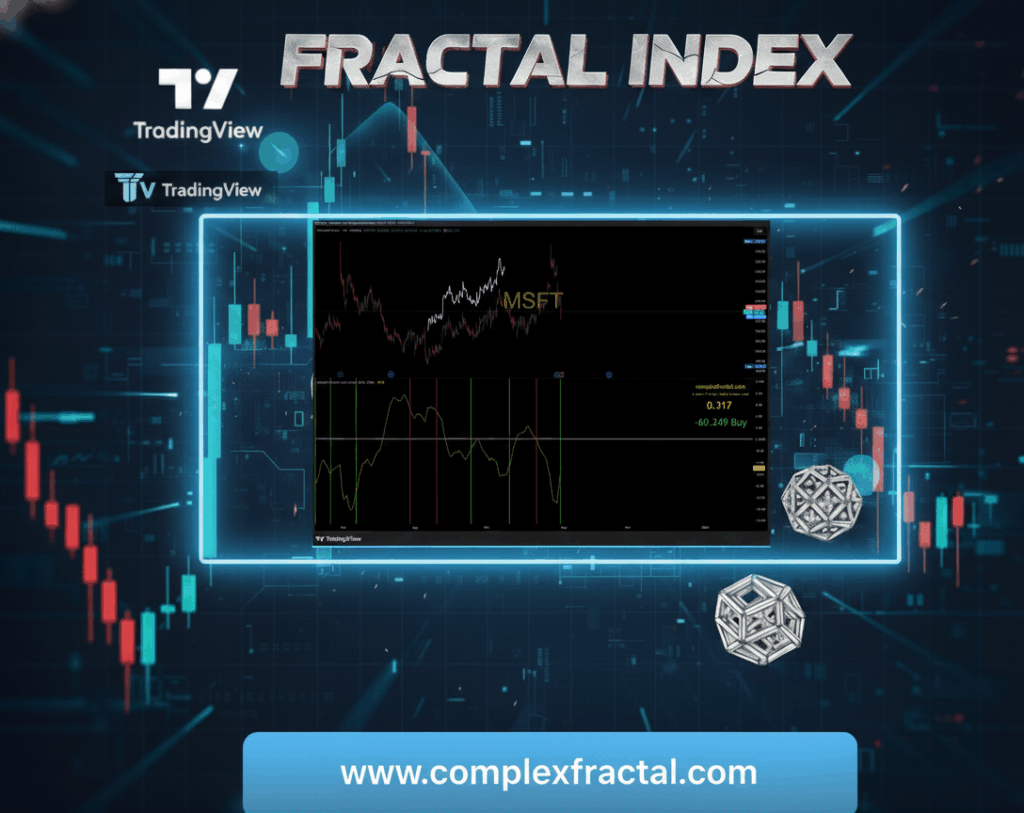
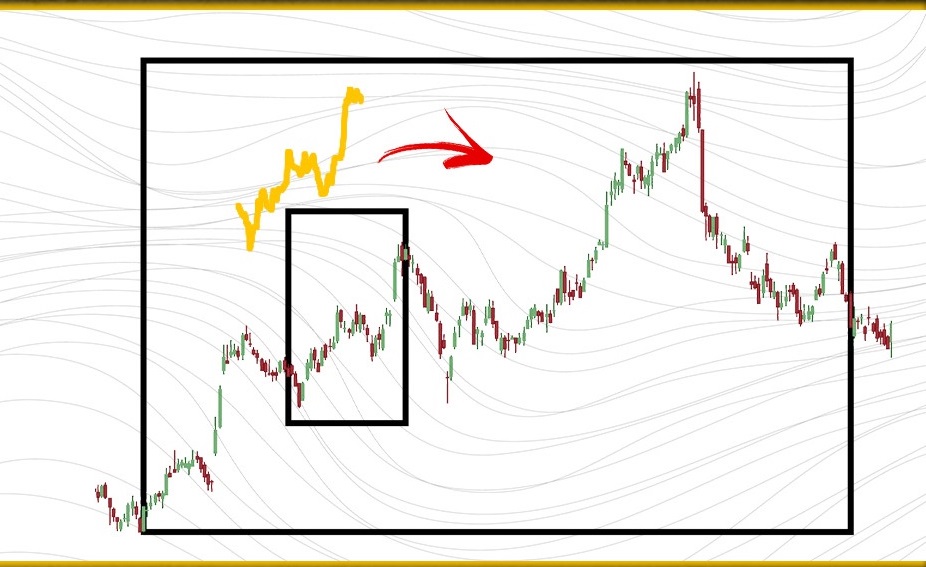
يعتمد المؤشر المُدعّم بالذكاء الاصطناعي الذي صممناه على خوارزميات متطورة مستوحاة من معادلات ماندلبروت وهندسة الفراكتل ويستخدم رياضيات متطورة لتحديد مواقع الفراكتلات بدقة من خلال نهج هندسي قائم على الموجات
تم دمج هذا المؤشر لتزويد متداولي الفراكتل بأداة فعّالة للغاية للتعرف على الأنماط. يُمكّنهم هذا المؤشر من فهم تحركات الأسعار بشكل أفضل، واتخاذ قرارات تداول مدروسة، وإجراء تحليلات دقيقة للأنماط الكسورية
المؤشر لمدة 6 أشهر + الدورة الفردية للفراكتل
على ماذا سوف تحصل؟
على الدورة الفردية الخاصة للفراكتل كما ورد في الاعلى
مع شرح خاص عليه Fractal level indicator اشتراك لمدة 6 أشهر على
1500$
1200$/month
المؤشر لمدة 6 أشهر
على ماذا سوف تحصل؟
Fractal level indicator ستحصل على اشتراك لمدة 6 أشهر على
لمدة 90 دقيقة ZOOM وعلى اجتماع لايف على برنامج
بالاضافة لفيديوهات تعلمية مسجلة
600$
450$/month

100$
منتجاتنا
دوراتنا التدريبية المتخصصة في تداول الفراكتل تُعلّمك كيفية تحديد أنماط الكسورية والاستفادة منها في الأسواق المالية، سواءً كنت مبتدئًا أو خبيرًا

دورة على الإنترنت
دورة تدريبية عن الفراكتل
دورة تدريبية فردية عبر زووم، تغطي مواضيع رئيسية: مقدمة في الفراكتل، وأنواعها، وأسرارها الخفية. تتضمن تطبيقات مباشرة ودعمًا مستمرًا عبر تيليجرام. المدة: خمس جلسات مباشرة عبر زووم
دورة على الإنترنت
دورة تدريبية عن الفراكتل مؤشرات حصرية
تدريب فردي مع خبير متخصص لتعلم أساليب مختلفة لتحليل الرسوم البيانية المالية باستخدام الفراكتل. يتضمن البرنامج 7 جلسات على مدار 15 يومًا، مع متابعة خاصة عبر تيليجرام. كما يتضمن اشتراكًا لمدة 6 أشهر في مؤشر الفراكتل

خدماتنا
تمكين المتداولين من خلال الأدوات والمعرفة المتطورة

دورات على الإنترنت
أتقن تداول الفراكتل مع دوراتنا الإلكترونية المتعمقة. تعلم بالسرعة التي تناسبك مع دروس يقدمها خبراء، وأمثلة واقعية من السوق، وموارد تفاعلية

TradingView مؤشرات
عزّز تحليلك للسوق باستخدام مؤشراتنا المُخصّصة. صُمّمت أدواتنا خصيصًا للمتداولين، حيث تُساعدك على تحديد الأنماط الكسورية وإشارات السوق الرئيسية بدقة

كورسات حضورية
انضم إلى جلسات التدريب المباشرة وبرامج الإرشاد لدينا للحصول على رؤى في الوقت الفعلي وإرشادات شخصية وممارسة عملية من المتداولين ذوي الخبرة

تطوير المنصات المالية
نحن متخصصون في بناء منصات مالية متطورة مصممة خصيصًا للمتداولين والمحللين والمستثمرين. من تحليلات البيانات إلى الأتمتة، نبتكر حلولًا فعّالة لتحسين تجربة التداول الخاصة بك
FAQ
ما هو الفراكتل ؟
التداول بلإستخدام الفراكتل هو أسلوب يستخدم أنماطًا هندسية متكررة موجودة في الطبيعة والأسواق لتحديد انعكاسات الأسعار المحتملة واستمرارها. تساعد هذه الأنماط المتداولين على تحديد نقاط التحول الرئيسية على الرسم البياني.
ما الذي يجعل مؤشر المستوى الكسري مختلفًا؟
مؤشرنا مُدعّم بالذكاء الاصطناعي وهندسة الفراكتل المتقدمة، مستوحاة من مجموعة ماندلبروت. يستخدم نموذجًا رياضيًا قائمًا على الموجات لاكتشاف مستويات الفراكنل عالية الدقة، موفرًا إشارات بصرية واضحة دون أي تخمين
هل يمكنني استخدام هذا المؤشر في أي سوق؟
Yes! The Fractal Level Indicator works on Forex, Crypto, Stocks, Commodities, and any other market available on TradingView. It adapts to different timeframes and instruments seamlessly.
هل أحتاج إلى حساب TradingView مدفوع؟
لا! مؤشرنا يعمل مع حسابات TradingView المجانية والمدفوعة. مع ذلك، قد تتطلب بعض الميزات المميزة في TradingView (مثل زيادة المؤشرات على مخطط واحد) اشتراكًا في خطة Pro.
هل تقدم تدريبًا حول كيفية استخدام المؤشر؟
بالتأكيد. نقدم دورة إتقان الكسورية كاملةً مع باقة الاشتراك المميزة لمدة 6 أشهر. ستتعلم كيفية القراءة والتفسير والتداول بثقة باستخدام أداتنا
أنا جديد في التداول. هل هذا المؤشر مناسب للمبتدئين؟
نعم! مؤشرنا مصمم للمبتدئين والمتداولين المحترفين على حد سواء. سهل الاستخدام مع رسومات توضيحية سهلة، ودورتنا تساعدك على فهم كل التفاصيل.
كيف يمكنني معرفة ما إذا كان المؤشر أو الدورة تساعد فعليًا في التداول الحقيقي؟
نحن ندرك أهمية النتائج. ولذلك نشارك أمثلة تداول واقعية – قبل وبعد – باستخدام مؤشر مستوى الفركتال مباشرةً عبر قناتنا على تيليجرام
ستجد هناك:
✅ إعدادات الرسم البياني الفعلية
✅ تحليلات التداول الفورية
✅ شرح مفصل للاستراتيجية خطوة بخطوة
✅ دليل على كيفية تحديد المؤشر لنقاط الدخول والخروج بدقة
ستتمكن من رؤية قيمة وفعالية أدواتنا في ظروف السوق المباشرة – وليس فقط النظرية.
🔗 Join our Telegram to follow our trades and market analysis.
